


Teams shipping LLM-integrated features often reuse the same APM dashboards that worked fine for deterministic services, then get paged for an incident those dashboards never flagged. At Varo Bank, watching this happen more than once across our Android, iOS, and web surfaces made one thing clear: the signals that used to be sufficient for monitoring weren’t sufficient anymore, not because the old signals were wrong, but because they were built for systems that didn’t have this failure mode.
Why a 200 OK Isn’t the Same Guarantee Anymore
Google’s SRE team defined the four golden signals of monitoring (latency, traffic, errors, and saturation) as the minimum set needed to understand whether a user-facing system is healthy. That framework holds up well for a deterministic API: A 200 response with the right latency means the request succeeded. It stops holding up once an LLM sits behind that endpoint. A chat completion can return HTTP 200, land well within your latency budget, and still answer the wrong question, cite a source that doesn’t exist, or call the wrong tool. None of the four golden signals catches that, because none of them were built to ask whether the content of a successful response is actually correct.
That gap is exactly why the industry has started building a second layer of signals on top of the classical four, specific to systems that call models. These are the ones I’ve found most useful, because they catch incidents earlier than latency or error rate alone. Several now appear in published LLM observability guidance; the first and last come from my own work:
- Retrieval and grounding drift: the retrieved context quietly stops matching what the model is actually citing, well before users notice anything wrong.
- Structured output failures: a 200 response containing content that fails schema validation, invisible to any monitor that only checks HTTP status.
- Guardrail and safety-filter trips rising: the model is technically responding successfully, but your own filters are catching a growing share of what it produces.
- Finish reason distribution shifting: a rising share of responses ending with length (cut off at the output token limit) instead of stop (completed naturally), meaning users are quietly getting truncated answers, often because prompts or tasks grew while max_tokens stayed fixed.
- Model version drift: the response metadata reports a different dated model snapshot than the one you tested against, even though the model alias in your code hasn’t changed.
- Cost per successful task climbing: a proxy for silent quality degradation, since retries and over-prompting show up in the bill before they show up anywhere else.
None of this replaces test automation; it extends it. The same discipline that catches a regression before release needs two layers for model output. Before release, I’d recommend three checks in CI, run against a fixed evaluation set on every build, the same way a regression suite runs: Schema validation on every structured output, a groundedness check that flags a response when its claims don’t trace back to the retrieved context (the faithfulness measure formalized in evaluation frameworks such as Ragas), and a tool-call correctness check confirming the model invoked the right tool with valid arguments, not just that it returned a 200. After release, the same checks run on a sample of live traffic, because a provider can change model behavior, or a data pipeline can change what the model retrieves, without a single line of your code changing. For the same reason, the CI checks should also run on a schedule, not only when code changes. Observability is what tells a team which of those checks to build first.
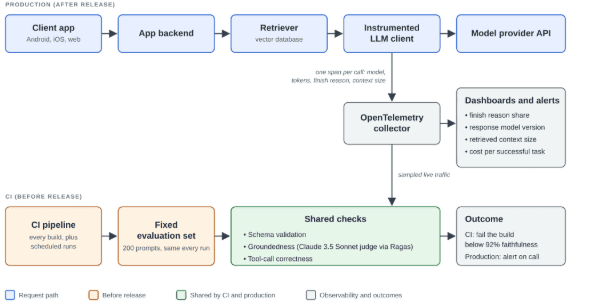
Figure 1: The same checks run in CI before release and on sampled live traffic after it. The CI path shows the setup we ran at Varo Bank.
At Varo Bank, I built schema and groundedness checks directly into our CI pipeline, catching model drift and regressions before they could reach user-facing features. The groundedness check used the Ragas faithfulness metric, with Claude 3.5 Sonnet as the judge to balance reasoning quality against CI speed. It ran a fixed set of 200 prompts on every build and on a schedule against the live model, and failed the build if the aggregate faithfulness score dropped below 92%. Each run added about four minutes and $1.50 to the pipeline.
That cost paid for itself in one incident. An update to how our vector database indexed documents subtly truncated the retrieved context, cutting out the daily transfer limits our chatbot relied on. Every request still returned a 200 within its latency budget. With the limits missing, the model invented them, and the CI check failed immediately as the faithfulness score fell to 65%. A dashboard built on the four golden signals would have shown nothing; by our estimate, the problem could have stayed live for up to four days, until confused answers turned into customer support tickets.
Standardizing Before the Next Incident
Standards bodies are already catching up. OpenTelemetry’s GenAI semantic conventions now define a standard way to instrument several of these signals (span names, token usage, finish reasons, agent and tool-call spans), and major instrumentation libraries have adopted them even though the specification is still being finalized. LangChain’s State of Agent Engineering survey, based on 1,340 practitioners, found that 89% have already adopted some form of observability tooling, rising to 94% among teams specifically running agents in production, but only 52% across all respondents run offline evaluations. That gap – dashboards everywhere, evaluation almost nowhere – is where most of these incidents live: Teams can see that something happened, but nothing in their setup was watching for the specific signal that would have caught it early.
Observability for LLM-integrated systems isn’t a different discipline from the one reliability engineers already practice. It’s the same discipline, pointed at a new set of signals, on a new class of failure that doesn’t announce itself with a status code. The teams standardizing their instrumentation around this now, rather than waiting for the gap to show up as an outage, are the ones who won’t be caught off guard by it later.

Frequently Asked Questions
1. Why aren't the four golden signals enough for LLM applications?
2. How can DevOps teams detect LLM failures before users notice?
3. What did Varo Bank's LLM evaluation pipeline uncover?

Ameya Chhatre is a Senior Software Engineer at PayPal, where he builds Android and iOS test automation frameworks from scratch, previously at Varo Bank and Google.